These are the three steps that I always recommend:
- find out what need drives your sales;
- find the country where that need is large and still growing;
- check the competition.
Step 1: find out what drives your sales
The first step is to see what general economic trends drive you sales. If you sell hearing aids, it may be the ageing of the population, if you sell electric bikes, it may be urbanisation.
Also for B2B products or services there may be indicators, for example comples HR software you only sell to companies with a certain size. How many of these companies are registered can often be found per country.
Step 2: find the country with growth
It is easier to introduce a product in a growing market than in a declining market. First buyers are not yet attached to another brand and competition in general may be less.
So search for the countries where the overarching need that drives your sales is growing rapidly, and start their your competitor investigations.
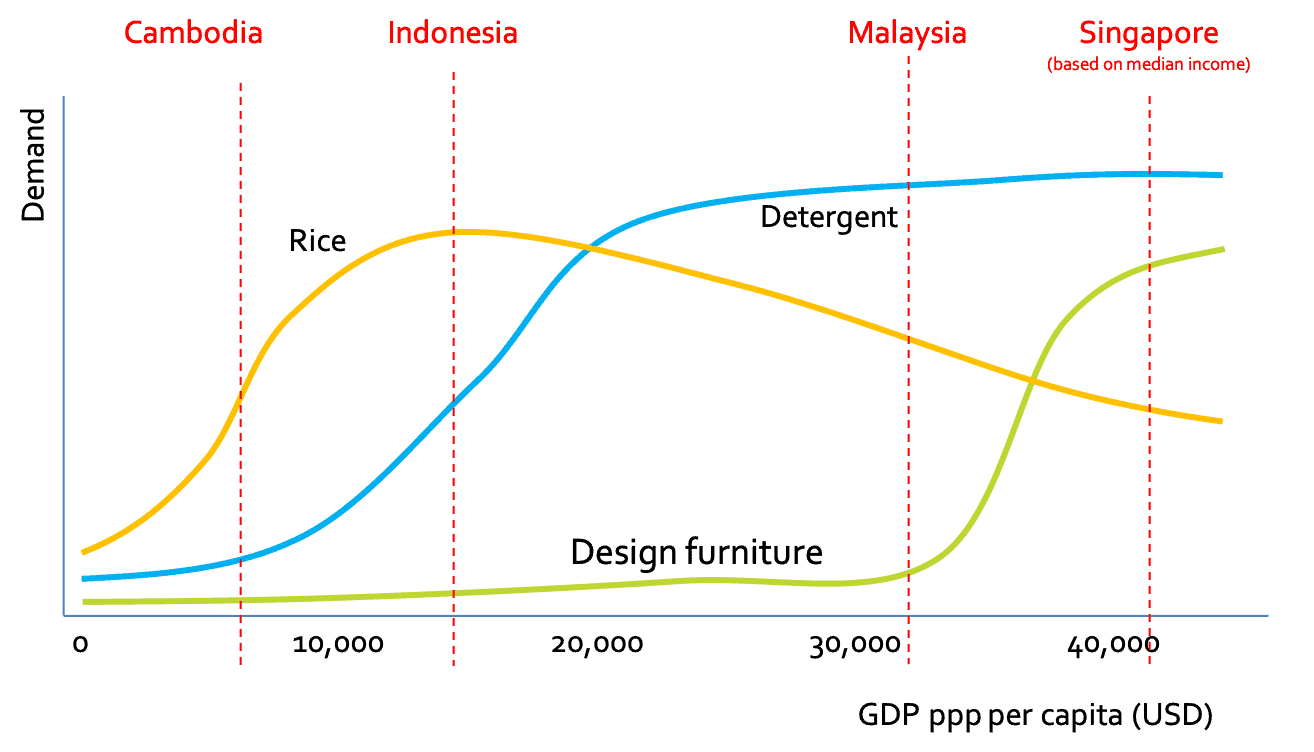
The product development curve
Even for a category where there always is a demand, like furniture, there is differentiation in the product quality. In large parts of Cambodia the only thing you may be able to sell is a cheap plastic chair. In Kazakhstan there is more buying power and a nice leather chair may be in reach of a large part of the population. While with a luxury massage chair you may have to target Western-European countries, the USA or Japan to reach some volumes.
A good proxy for buying power is the GDP ppp per capita, which is the Gross Domestic Product of a country, corrected for the general price level, per inhabitant. That’s because with 100 euro you can buy more in Thailand than in Japan or Australia.
When the GDP ppp per capita rises, the demand for more luxury goods grows, the demand for necessities like detergents remains stable, and the demand for basic products may even decline, e.g. with rice since it’s being replaced by bread, fries or pasta.
Step 3: Check the competition
Don’t forget the last step, to see what competition you can expect. As a foreigner, you often have a disadvantage in production costs or delivery times. And except for the case where there is substantial growth in the market, you will have to convince either your distributors or your end- customers to let go of another product, that may be local.
One key question is how fragmented the competition is. For example in research that I did for cutting tools like drills and taps I found that the Dutch market is extremely fragmented, no brand had over 10% of the market.
This was different in Romania, where there was one clear leading competitor. Chances of entering the market successfully were therefore much better in the Netherlands.
From 200 countries to 55 to start with
Especially for mid-sized companies, not every country is suitable to export to. With over 200 countries and territories in the world, you will see that using three easy to find criteria, you can filter down to 55 markets that you may consider as one of your first international expansion goals.
Filter 1: Market Size
Small markets cost relatively a lot of investments compared to the turnover that you can achieve. So I first filtered out all countries with a GDP less than Cyprus, which is around 32 billion USD.
Filter 2: Purchasing power
Purchasing power can best be measured with the GDP per capita, corrected for purchasing parity. In this case I filtered out all countries with a GDP ppp per capita less than 9.000 USD.
Filter 3: Ease of doing business
Finally I took out all countries in the lower half of the ease-of-doing-business index. This left out countries like the Argentina, Brazil and Pakistan, leading to a remaining 55 countries.
The list of 55 countries to consider first
| Country | Population (millions) | GDP (billion USD) | GDP per Capita (USD) | GDP PPP per Capita (USD) | Urbani-zation (%) | Population > 65 (%) | Primary Industry (%) | Secondary Industry (%) | Tertiary Industry (%) | Ease of Doing Business Index |
|---|---|---|---|---|---|---|---|---|---|---|
| Australia | 26.0 | 1,560 | 60,000 | 57,000 | 89 | 16.1 | 2.5 | 25.0 | 72.5 | 14 |
| Austria | 8.9 | 455 | 51,250 | 53,700 | 58 | 17.4 | 1.5 | 25.0 | 73.5 | 27 |
| Belgium | 11.5 | 596 | 51,913 | 55,500 | 98 | 19.0 | 1.2 | 25.8 | 73.0 | 46 |
| Canada | 38.0 | 1,640 | 43,000 | 51,000 | 82 | 16.1 | 2.0 | 28.0 | 70.0 | 23 |
| China | 1,400.0 | 14,000 | 10,000 | 18,000 | 60 | 10.6 | 8.5 | 42.5 | 48.0 | 31 |
| Colombia | 50.0 | 400 | 8,000 | 16,000 | 80 | 9.5 | 7.4 | 35.3 | 57.3 | 59 |
| Denmark | 5.8 | 400 | 69,000 | 58,000 | 88 | 19.0 | 1.5 | 28.0 | 70.5 | 4 |
| Finland | 5.5 | 290 | 52,000 | 50,500 | 85 | 20.5 | 2.0 | 27.0 | 71.5 | 10 |
| Finland | 5.5 | 290 | 52,000 | 50,500 | 85 | 20.5 | 2.0 | 27.0 | 71.5 | 10 |
| France | 67.0 | 2,780 | 41,500 | 49,500 | 81 | 19.0 | 2.0 | 30.0 | 68.0 | 31 |
| Germany | 83.0 | 4,100 | 49,400 | 57,400 | 77 | 21.5 | 1.5 | 28.0 | 70.0 | 22 |
| Greece | 10.4 | 385 | 37,000 | 41,000 | 80 | 21.0 | 4.0 | 24.0 | 72.0 | 79 |
| India | 1,400.0 | 3,000 | 2,100 | 9,000 | 35 | 6.5 | 15.0 | 26.0 | 59.0 | 63 |
| Indonesia | 273.0 | 1,100 | 4,200 | 10,000 | 56 | 6.1 | 12.0 | 39.0 | 49.0 | 73 |
| Italy | 60.4 | 2,100 | 34,800 | 40,000 | 70 | 22.1 | 2.5 | 28.0 | 69.0 | 58 |
| Japan | 126.0 | 5,000 | 39,500 | 46,000 | 92 | 28.0 | 1.0 | 25.0 | 74.0 | 29 |
| Jordan | 10.3 | 50 | 5,000 | 9,000 | 88 | 6.7 | 8.0 | 21.0 | 71.0 | 75 |
| Kazakhstan | 18.8 | 180 | 9,600 | 21,000 | 57 | 7.0 | 13.5 | 26.0 | 60.5 | 35 |
| Korea, South | 51.0 | 2,100 | 41,000 | 47,000 | 81 | 14.1 | 2.0 | 32.5 | 65.5 | 5 |
| Kuwait | 4.4 | 70 | 15,900 | 35,000 | 98 | 2.9 | 0.0 | 60.0 | 40.0 | 86 |
| Latvia | 1.9 | 39 | 20,500 | 32,000 | 68 | 16.7 | 4.5 | 27.8 | 67.7 | 19 |
| Lithuania | 2.8 | 55 | 19,600 | 28,800 | 67 | 18.9 | 3.0 | 25.0 | 68.0 | 16 |
| Luxembourg | 0.6 | 75 | 133,000 | 116,000 | 94 | 21.0 | 0.0 | 22.0 | 78.0 | 61 |
| Malaysia | 32,4 | 370 | 11,400 | 21,000 | 76 | 5.5 | 7.2 | 37.5 | 55.3 | 12 |
| Malta | 0.5 | 15 | 28,200 | 38,000 | 94 | 16.7 | 0.0 | 26.4 | 73.3 | 53 |
| Mexico | 128.9 | 1,300 | 10,100 | 20,000 | 80 | 9.1 | 12.5 | 33.0 | 54.5 | 74 |
| Morocco | 36.5 | 120 | 3,300 | 9,000 | 63 | 9.5 | 12.0 | 27.0 | 61.0 | 53 |
| Netherlands | 17.5 | 920 | 52,600 | 60,000 | 92 | 19.0 | 2.5 | 25.0 | 72.5 | 28 |
| New Zealand | 5.0 | 210 | 42,000 | 46,500 | 86 | 15.2 | 6.0 | 28.0 | 66.0 | 17 |
| Norway | 5.4 | 500 | 92,500 | 97,500 | 80 | 19.0 | 2.0 | 20.0 | 78.0 | 15 |
| Oman | 4.5 | 80 | 17,700 | 35,000 | 82 | 3.2 | 0.0 | 70.0 | 30.0 | 71 |
| Panama | 4.4 | 66 | 15,000 | 30,000 | 79 | 9.8 | 6.5 | 27.0 | 66.5 | 51 |
| Peru | 33.5 | 220 | 6,500 | 15,000 | 77 | 8.9 | 7.0 | 31.0 | 61.0 | 74 |
| Philippines | 113.0 | 500 | 4,400 | 11,000 | 47 | 4.1 | 10.0 | 36.0 | 54.0 | 95 |
| Poland | 38.3 | 640 | 16,700 | 32,000 | 60 | 16.1 | 2.0 | 35.0 | 63.0 | 40 |
| Portugal | 10.3 | 230 | 22,400 | 34,000 | 65 | 23.3 | 3.1 | 24.0 | 72.9 | 39 |
| Qatar | 2.8 | 190 | 68,000 | 98,000 | 99 | 2.0 | 0.0 | 53.0 | 47.0 | 24 |
| Romania | 19.0 | 300 | 15,800 | 30,000 | 55 | 16.5 | 5.0 | 28.0 | 67.0 | 55 |
| Russia | 144.5 | 1,700 | 11,700 | 24,500 | 74 | 14.0 | 4.2 | 28.0 | 67.8 | 28 |
| Saudi Arabia | 35.0 | 1,000 | 28,600 | 58,000 | 85 | 3.1 | 0.0 | 55.0 | 45.0 | 62 |
| Singapore | 5.6 | 400 | 71,000 | 91,000 | 100 | 14.0 | 0.0 | 19.0 | 81.0 | 2 |
| South Africa | 59.0 | 450 | 7,600 | 14,000 | 67 | 9.1 | 8.2 | 29.0 | 62.8 | 84 |
| South Korea | 51.7 | 1,800 | 34,800 | 55,000 | 82 | 15.5 | 2.0 | 37.0 | 61.0 | 5 |
| Spain | 47.0 | 1,500 | 31,900 | 48,000 | 80 | 19.0 | 2.0 | 24.0 | 74.0 | 30 |
| Sweden | 10.3 | 600 | 58,300 | 60,000 | 87 | 19.8 | 2.0 | 26.0 | 72.0 | 10 |
| Switzerland | 8.5 | 900 | 105,000 | 91,000 | 74 | 15.4 | 1.2 | 27.5 | 71.3 | 2 |
| Taiwan | 23.5 | 900 | 38,000 | 60,000 | 78 | 14.1 | 2.0 | 34.0 | 64.0 | 19 |
| Thailand | 70.0 | 550 | 7,800 | 18,000 | 50 | 10.1 | 10.0 | 38.0 | 52.0 | 21 |
| Turkey | 83.0 | 900 | 10,800 | 22,000 | 76 | 8.9 | 10.0 | 30.0 | 60.0 | 33 |
| Ukraine | 43.7 | 170 | 3,900 | 12,100 | 69 | 15.0 | 11.0 | 27.0 | 62.0 | 64 |
| United Arab Emirates | 9.3 | 420 | 45,000 | 70,000 | 86 | 2.5 | 0.0 | 39.0 | 61.0 | 16 |
| United Kingdom | 67.0 | 3,100 | 46,000 | 61,000 | 83 | 18.0 | 1.0 | 19.0 | 80.0 | 8 |
| United States | 332.0 | 25,000 | 75,000 | 77,000 | 82 | 16.0 | 1.0 | 19.0 | 80.0 | 6 |
| Uruguay | 3.5 | 80 | 23,100 | 38,000 | 95 | 16.4 | 8.0 | 26.0 | 66.0 | 74 |
| Vietnam | 99.0 | 450 | 4,500 | 11,000 | 34 | 6.2 | 19.0 | 28.0 | 53.0 | 70 |